
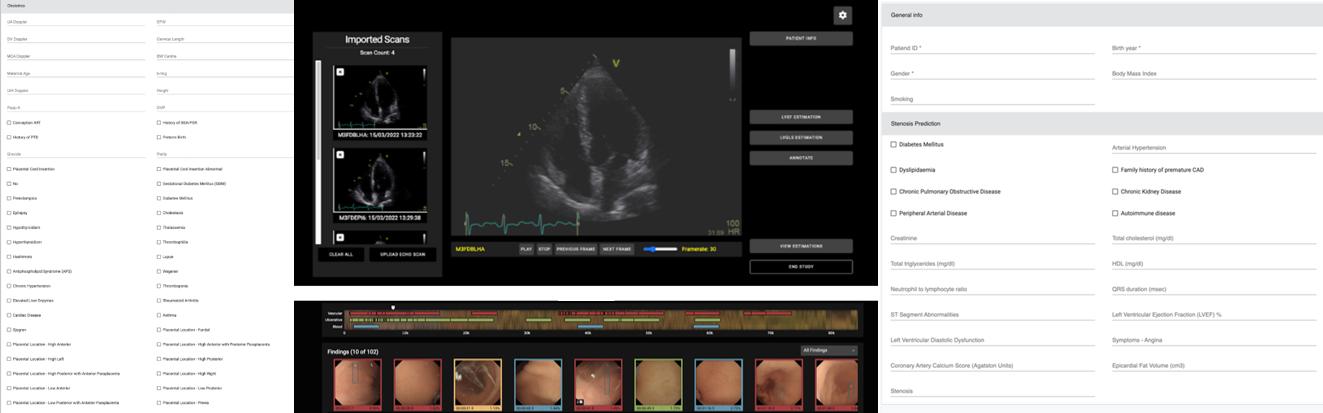
Clinician-friendly, interpretable computer-aided diagnosis system to support and optimise clinical decision making
Misdiagnosis and delayed diagnosis are two of the most common types of medical malpractice, leading to patients not receiving proper and timely care and to subsequent serious deterioration of their health or even death. In HosmartAI, a suite of four computer-aided diagnosis (CADx) tools were developed to support four distinct challenging clinical scenarios. The four clinical scenarios are:
- Assessment of left ventricle function with echocardiography (ECHO)
- Detect suspicious findings in video capsule endoscopy (VCE)
- Predict >50 stenosis of the coronary artery using coronary computed tomography angiography (CCTA)
- Predict adverse effects, mainly preterm birth, from obstetrics data
The aim of the CADx tools is the optimisation of the processes involved in these clinical scenarios by combining hardware and software components based on recent technological advances in AI. Specifically, the objectives of using these CADx tools are to 1) increase diagnostic yield and 2) reduce time to diagnosis, regardless of the health care professional level of experience. Eventually, four clinical pilot studies are being conducted for validating the performance and utility of the developed software tools.
ECHO tool
The assessment of left ventricular (LV) function is critical for diagnosis, management, follow-up, and prognostic evaluation of patients with cardiac problems. ECHO provides a useful means to measure a series of LV function related metrics two significant of them are the LV ejection fraction (LVEF) and LV longitudinal strain (LVGLS). A common issue in the quantification of LVEF and LVGLS is interobserver variability, i.e., different clinicians result in different metrics for the same ECHO clip.
The ECHO tool is a web application powered with AI functionalities that assists cardiologists to assess the LV function. The AI functionalities automates the estimation of LV function related parameters, i.e., LV ejection fraction (LVEF) and longitudinal strain (LVGLS). The LVEF estimation function is an implementation of EchoNet-Dynamic deep learning model, whereas the LVGLS estimation function is a multi-stage video processing approach that incorporates the detection of cardiac cycles and the motion tracking of the endocardial border.
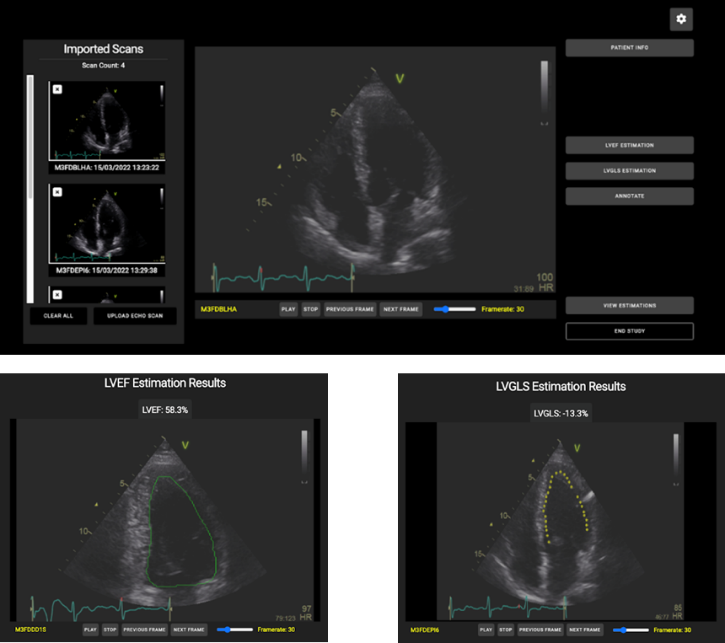
ECHO tool: (above) A screenshot of the main GUI of the web application where the user can import ECHO clips as DICOM data, navigate and study the imported clips, and apply AI. (below) Two screenshots with the outcomes of the two AI functionalities, (left) LVEF and (right) LVGLS estimates.
VCE tool
VCE is an effective non-invasive method to examine small intestine disorders, but it suffers long review times and need for experienced personnel. The VCE tool is a CADx web application that allows a gastroenterologist to optimally review a VCE examination for assessing the condition of the small bowel. The VCE tool is powered with AI functionality which allows automatic detection of potential abnormalities, aiming at improving diagnostic performance together with reducing the duration of the examination.
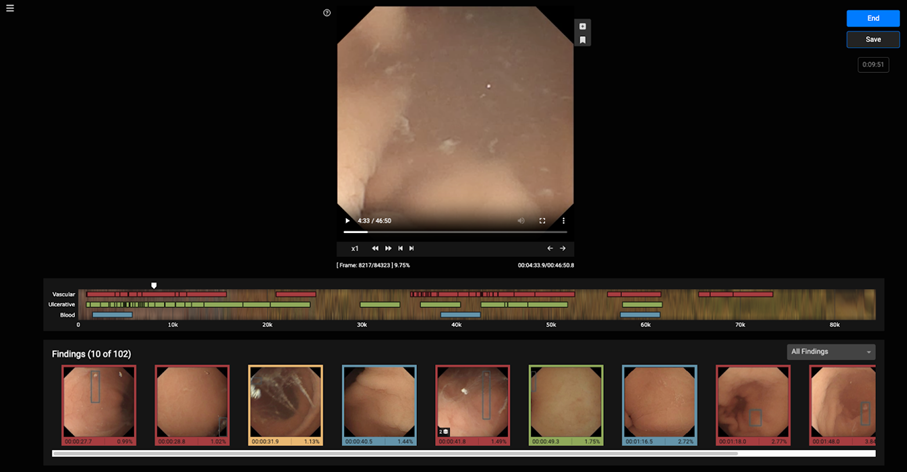
The final version of the VCE tool is a web application the main functionalities of which are:
- viewing capsule endoscopy videos
- manually annotating suspicious findings
- applying the AI pipeline and presenting the outcomes in a user-friendly manner
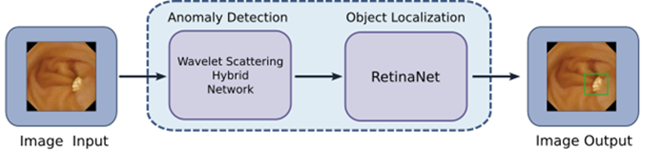
A novel AI approach has been developed that combines abnormality detection followed by object detection. The former implements a hybrid wavelet scattering network and its purpose is to exclude obvious normal images from further processing. The latter implements a RetinaNet deep neural network whose purpose is to detect and localise suspicious structure in the image.
CCTA tool
Coronary Computed Tomography Angiography (CCTA) is an essential diagnostic method for the assessment of coronary artery stenosis. However, the overuse of CCTA in patients with low or intermediate pre-test probability (PTP) of having coronary artery disease (CAD) often leads to unnecessary examinations and healthcare costs. The CCTA tool developed in HosmartAI is aimed at optimizing patient selection for CCTA by predicting the likelihood of significant coronary artery stenosis (stenosis severity > 50%).
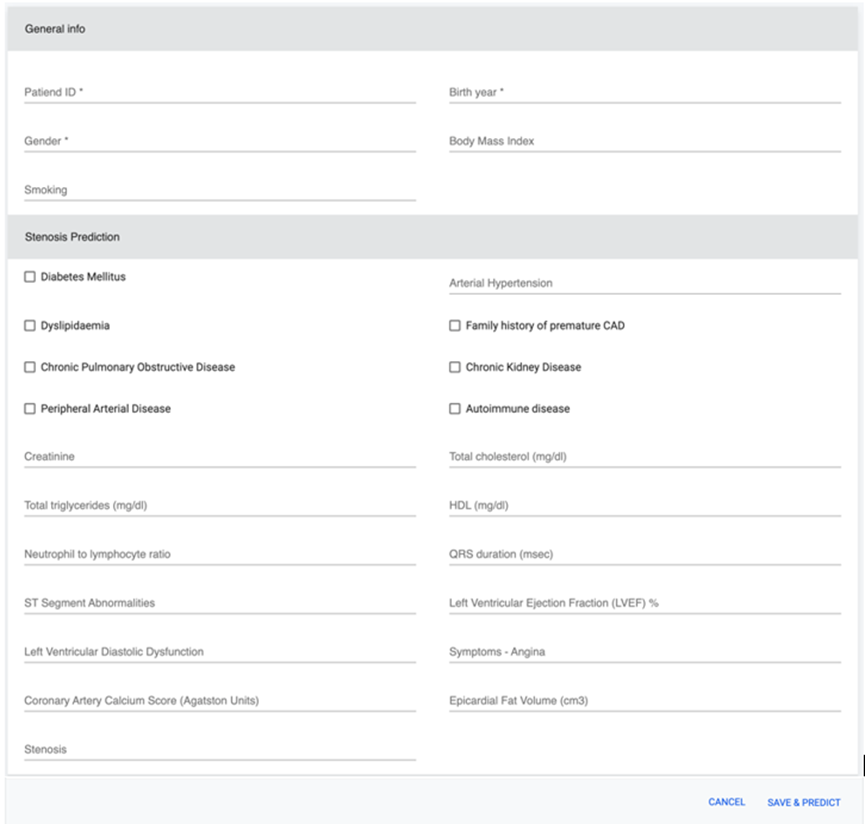
Screenshot of the CCTA web application
The CCTA tool is a computer-aided diagnosis system that leverages machine learning (ML) algorithms, including XGBoost and Voting ensemble, to analyze patients’ objective results, clinical variables, demographics, and other medical data. This information is used to efficiently predict the PTP of stable CAD, thus identifying patients who may not require additional diagnostic testing. SHapley Additive exPlanations (SHAP) are integrated to provide model explicability and interpretability, allowing clinicians to understand the decision-making process of the model.
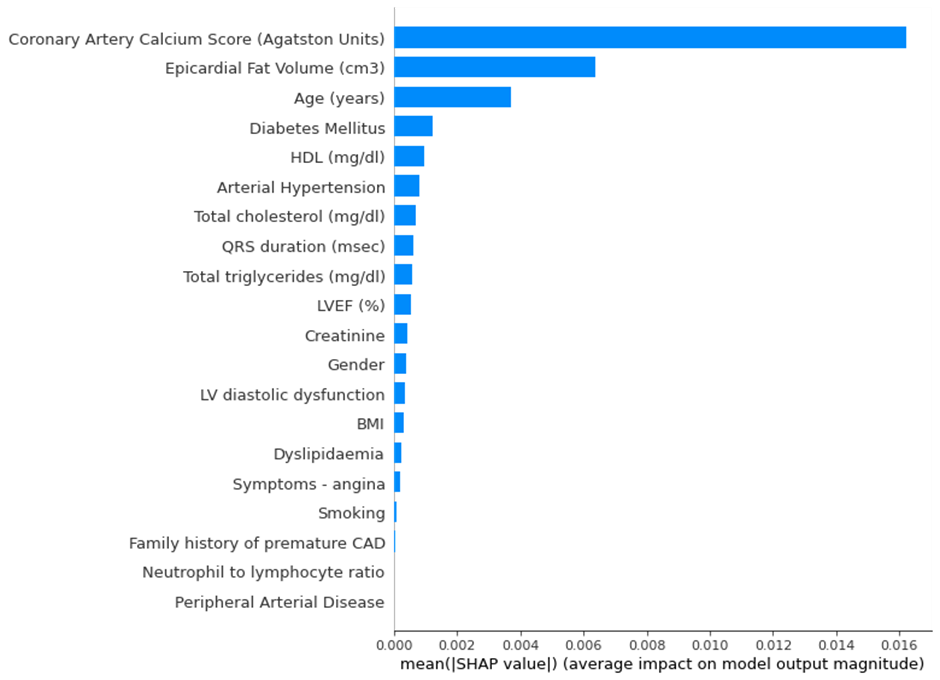
Explainability component
A critical component of this tool is its focus on interpretability, allowing medical professionals to make more informed decisions. It assists physicians in making more efficient use of CCTA, reducing discomfort to the patients and costs for hospitals. The explainable component added to the models with SHAP enables clinicians to see and understand how each model makes a decision, applying their domain knowledge to choose the most appropriate model.

Explainability component
The CCTA tool offers several advantages over traditional methods, including the reduction of the need for invasive CCTA, better patient selection, enhancing cost-effectiveness, and improving diagnostic yield. Its alignment with the clinical guidelines provided by the European Society of Cardiology (ESC) and the careful consideration of local explanations with SHAP make it a valuable asset in contemporary clinical practice.
Obstetrics tool
Preterm birth (PTB) is a serious global health concern due to its potential short- and long-term complications. The main challenge in obstetrics is to predict and reduce the risk of PTB, ensuring both the mother and child’s health. In recent times, AI and machine learning techniques have been leveraged to assist clinicians in predicting PTBs. This paper presents an advanced obstetrics tool, drawing inspiration from previous solutions such as the QUiPP application and PredictPTB model, but elevates these with enhanced accuracy and interpretability.
Tool Overview:
The primary objective of this obstetrics tool is to use machine learning algorithms in an interpretable manner to predict PTBs. Based on a dataset of 375 pregnancies, this tool amalgamates various predictive models including Logistic Regression, SVM, Random Forest, XGBoost, and an MLP neural network. To boost performance, ensemble methods like Voting and Stacking are employed. For transparency and clinical trust, Shapley Additive Explanations (SHAP) were integrated to offer both global and local explanations of the model’s predictions.
Tool Features:
Dataset and Preprocessing: The tool processes a detailed dataset encompassing demographics, medical history, and specific obstetric variables, ensuring comprehensive consideration of all potential factors influencing PTB. The dataset was refined through encoding techniques, imputation methods, and balancing techniques like SMOTE.
Screenshot of the PTB web application
Predictive Models: Multiple machine learning algorithms, including Logistic Regression, SVM, Random Forest, XGBoost, and MLP, are at the tool’s core. Performance enhancement is achieved using Voting and Stacking ensembles.
High Predictive Accuracy: Among the tested models, the Voting ensemble displayed the highest accuracy, achieving an impressive 81%. Such high accuracy ensures that clinicians can trust the tool’s predictions.
Interpretability: The tool stands out in its commitment to interpretability. Using SHAP, it provides both global explanations (overall feature importance across predictions) and local explanations (specific rationale behind individual predictions). This fosters trust and understanding among clinicians, crucial when dealing with life-impacting predictions.
Graphical Interface:
ROC-AUC and PR-AUC Visualization: The tool offers an insightful graphical representation of performance metrics, helping clinicians visualize and compare the efficiency of different predictive models.
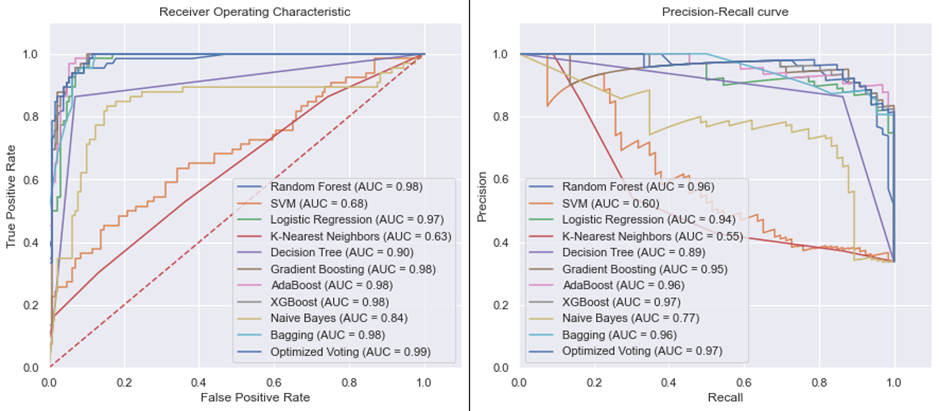
PTB prediction algorithms
Feature Importance: A visual representation of global feature importance shows which features most strongly impact predictions.
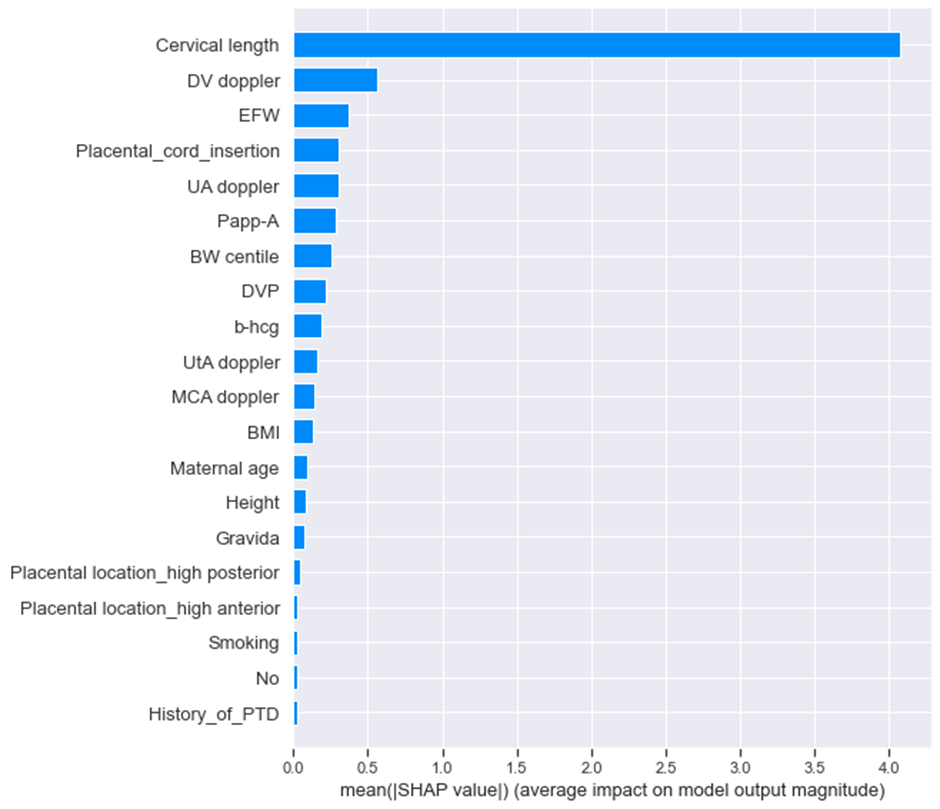
Explainability component
Furthermore, a local explanation visualization explains individual predictions, assisting clinicians in understanding case-specific factors.
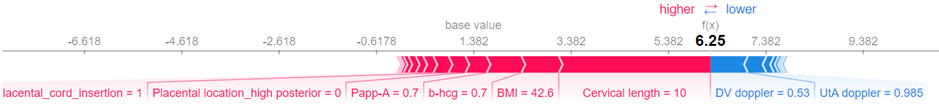
Explainability component
Conclusions and Forward Path:
This obstetrics tool significantly advances PTB prediction by intertwining superior predictive accuracy with interpretability. Its transparent methodology ensures that clinicians can not only trust its predictions but also understand the reasoning behind them. Future enhancements are centered on expanding the dataset and refining validation techniques.